BIG DATA
Artificial Intelligence and Pandemics: How Analytics Can Help
How data-driven decision-making can flatten the curve at all stages of an outbreak
By Tara Holland
New York governor Andrew Cuomo is emerging as a leader in the fight against the Covid-19 pandemic that is crippling the world. His state has been the hardest hit in the U.S., possibly one of the hardest-hit regions in the world, but his staunch resistance to prematurely opening up the state economy has resonated with people.
“I operate on facts and on data and on numbers and on projections,” he told reporters in March. “Not, ‘I feel,’ ‘I think,’ ‘I believe,’ ‘I want to believe.’ Make the decisions based on the data and the science.”Those could be the words of a data scientist.
We are swimming in the very data that we need to combat this pandemic and its public health impact: prediction, treatment, allocation of resources, recovery. How can we harness the power of that data to stem the tide of this pandemic, and prepare for the next?
Checking the Spread
It’s estimated that 80 percent of new human diseases have “jumped species.” As human population grows largely unchecked, we come into increasing contact with animals that, though possibly asymptomatic themselves, harbor viruses that can spread to humans with deadly results. With volumes of detailed data on population, migration patterns and cultural practices, artificial intelligence can model those interactions to predict the hot spots for interactions with unfamiliar creatures.
We also have huge amounts of data from airlines, customs, and railroads from which we can forecast with great accuracy how disease might spread. The power of analytics technology has grown by leaps and bounds, even since the Ebola outbreak of 2014. After the fact, researchers used AI and travel data to remodel the spread of the virus with astonishing accuracy, right down to the county level in Texas.
Mining social media content with natural language processing can reveal travel patterns and anomalous illness outbreaks to supplement that travel data, and can do it much faster than traditional forecasting methods.
We can also model how different responses—or lack thereof—can influence the spread of an outbreak. What-if analyses can help direct policy decisions and resource allocation to mitigate the spread. Knowing more, and knowing it sooner, is key to a pandemic response.
Shaping the Response
Policymaking supported by data scientists is still too rare. A key to shaping the response to a public health emergency is presenting a huge volume of data in a fashion that government officials can understand. Consider the number of data sources that must be interpreted and integrated into pandemic response:
Public health: Where is testing being done? What is the location of confirmed cases? What are regional recovery rates? If there’s a noticeable difference among regions, why?
Medical resources: Where are the clinicians? How many hospital beds are available, and where? Where are there ventilators and other critical equipment? Where should supplies be directed?
Social Determinants of Health: Covid-19 has had an uneven impact on the population. Where are the pockets that are suffering heavily? Who is suffering from housing and food insecurity? Current social programs data can point the way.
Crime: Where are the “hot spots” of escalating crime during the outbreak? How do we direct front-line law enforcement resources?
Essential workforce: How many nurses, personal support workers, first responders, army reservists, and others wanting to help, and where? How can they be better deployed and supported?
Emergency Benefits: Real-time data on provincial and federal measures being rolled out to support families, communities and local businesses who face financial crisis. Understanding commerce and employment by region and industry can help flesh out the pandemic impact picture.
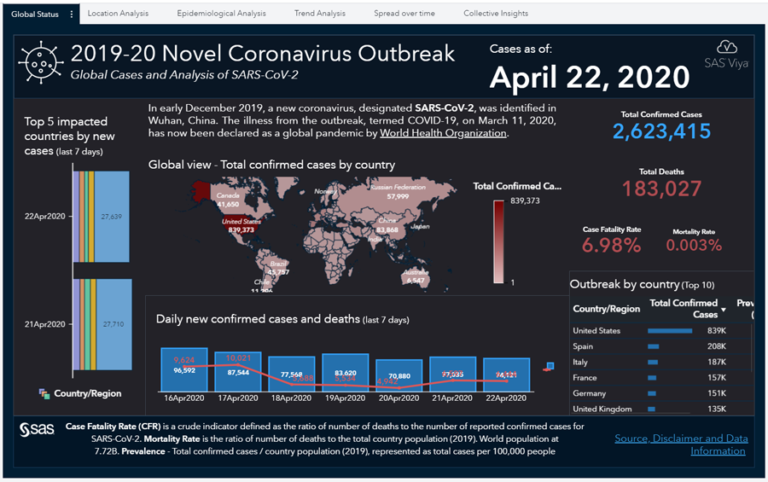
That’s a lot to take in. A well-designed dashboard that integrates that data visually, in a user-friendly format, helps decision-makers understand the impact of an outbreak. Interactive visuals can demonstrate the impact of government intervention, whether related to commerce, public safety and health, and public welfare. A clear, comprehensive visual can guide policy-makers to shape their response.
SAS has an online tool, based on its Viya platform, that allows interaction with collected Covid-19 data visually to predict how it can be influenced.
Treatment and Recovery
Deep learning—another AI technology—comes into its own when developing treatments for viral outbreaks. By using imagery of Coronavirus patients—X-rays, ultrasounds, and the like—as a data input, deep learning technology can create models that speed diagnosis, analyze the effectiveness of existing treatments, and even point in the direction of new, more effective treatments. Researchers still aren’t sure how Covid-19 is killing us. New York Times columnist Charlie Warzel listed 48 “known unknowns” about the virus, and it’s not a comprehensive list. That’s a field ripe for the application of AI technologies; integrating and modeling huge volumes of data can lead to answers.
AI can also point researchers in the direction of effective viral medications and vaccines by digesting volumes of data from similar outbreaks. Recently, Australian researchers created the first AI-developed vaccine, saving years of time and millions of dollars.
When this pandemic is contained, AI technologies will speed the recovery and preparedness of policymakers for the next outbreak. A data-driven response has a better likelihood of preventing or quickly containing such a pandemic. We should strive for that.
About The Author

Tara Holland
Tara Holland, Principal, Global Government Practice at SAS Institute. Being a part of the SAS global government team, She is able to bring analytics solutions and expertise from around the world to governments across Canada. Her role is to connect and collaborate the best resources from government clients, partners and all business units within SAS.